Xdebug, PhpStorm, and DrupalVM are all independently awesome tools. Using them together gives you incredible development and debugging powers, but they take a little practice to set up correctly. This tutorial will walk you through that process, and should only take a few minutes.
Configure DrupalVM and Xdebug
Start by enabling Xdebug in your DrupalVM instance. You should do this by adding the appropriate configuration to the box/config.yml file and then running vagrant provision. I recommend using the following configuration, based on that provided by BLT:
php_xdebug_default_enable: 1

php_xdebug_remote_enable: 1

php_xdebug_remote_connect_back: 1

php_xdebug_idekey: PHPSTORM

php_xdebug_remote_port: "9000"
After you reprovision your VM, verify that xdebug is enabled on the CLI:
vagrant ssh

php -i | grep xdebug
Configure PhpStorm
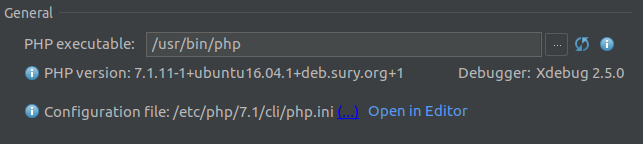
Now you need to tell PhpStorm how to talk to the PHP CLI in DrupalVM. Do this by adding a remote PHP interpreter: in your project settings, navigate to Languages and Frameworks->PHP and click the ... next to CLI Interpreter. Click the green plus symbol to add a new interpreter "From Docker, Vagrant, VM, Remote...". In the dialog that opens, choose Vagrant and PhpStorm should automatically discover the PHP CLI in DrupalVM. After saving, make sure PhpStorm sees Xdebug as enabled:
Configure your browser
Stick with me, you're almost done! The final setup step is to create a JS bookmarklet that you will use to set the XDEBUG_SESSION cookie each time you want to start debugging via a browser. You can use PhpStorm to generate this bookmarklet, or use mine:
javascript:(function() {document.cookie='XDEBUG_SESSION=PHPSTORM;path=/;';})()
Start debugging!
This is what you've waited for! Do these steps at the start of each debugging session:
- Click the bookmarklet you just created
- Click "start listening for PHP Debug connections" (looks like
 ) in the upper-right corner of PhpStorm
 - Set a breakpoint in PhpStorm, or toggle the option to break at the first line of scripts
- Reload a page in your browser. If everything is set up correctly, PhpStorm should start a debug session!